Overview
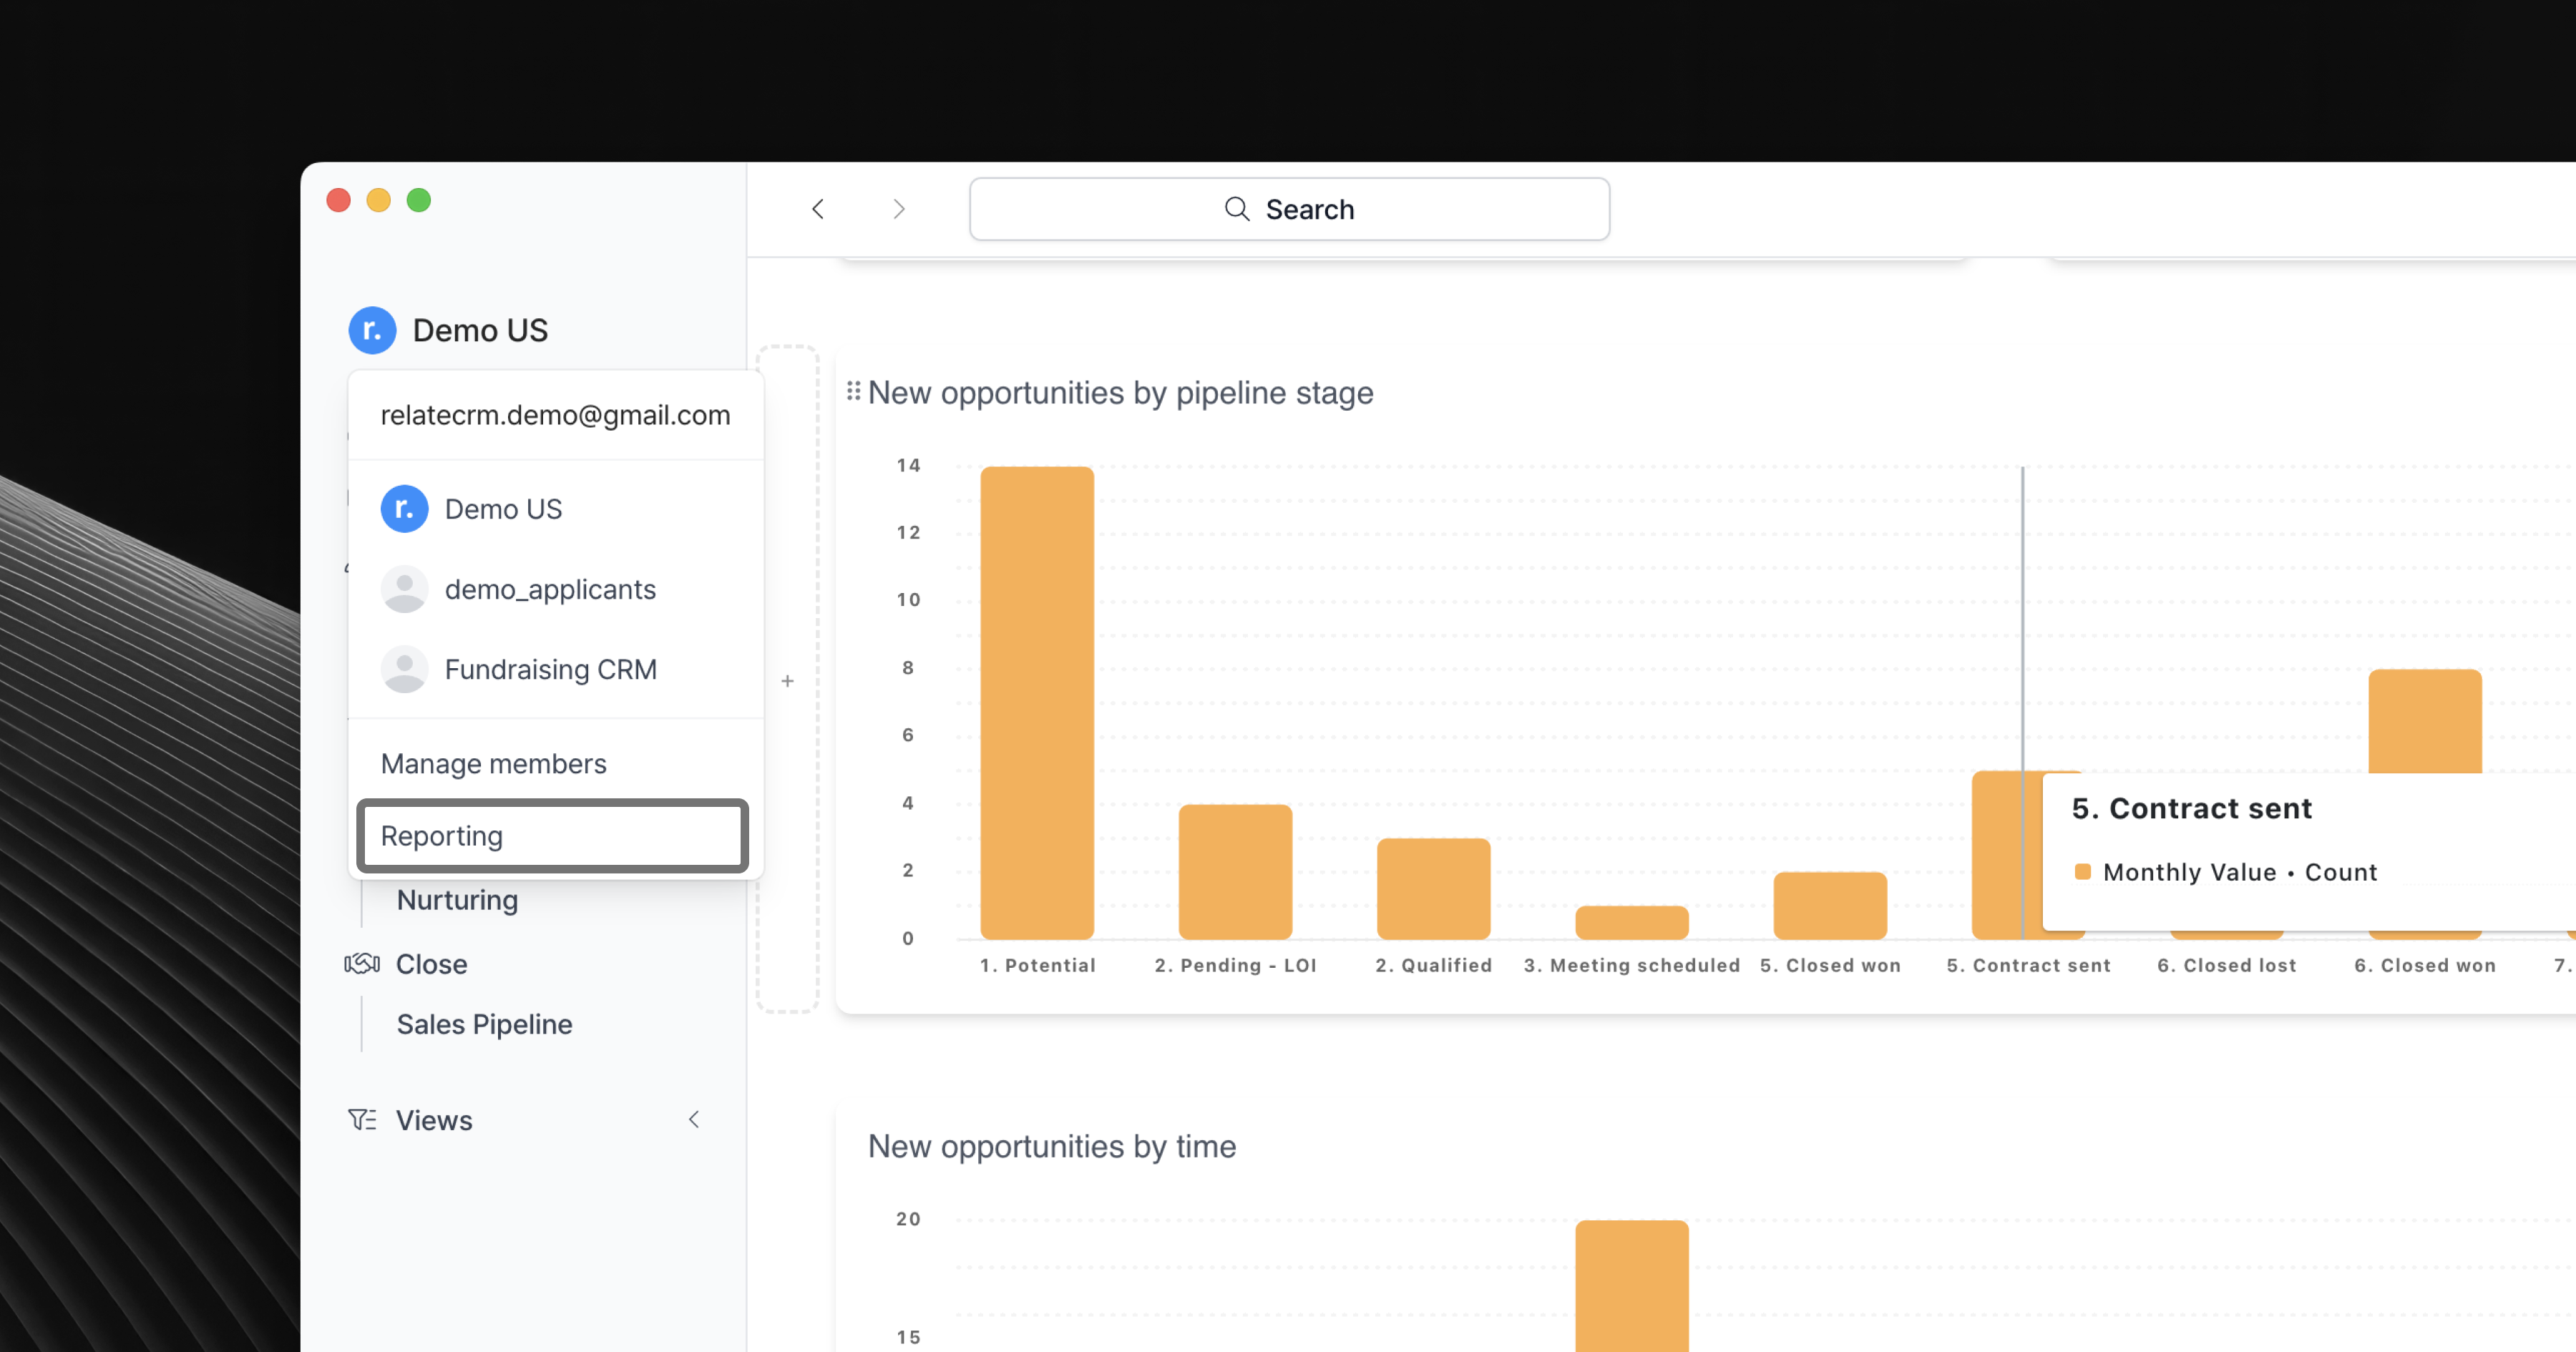
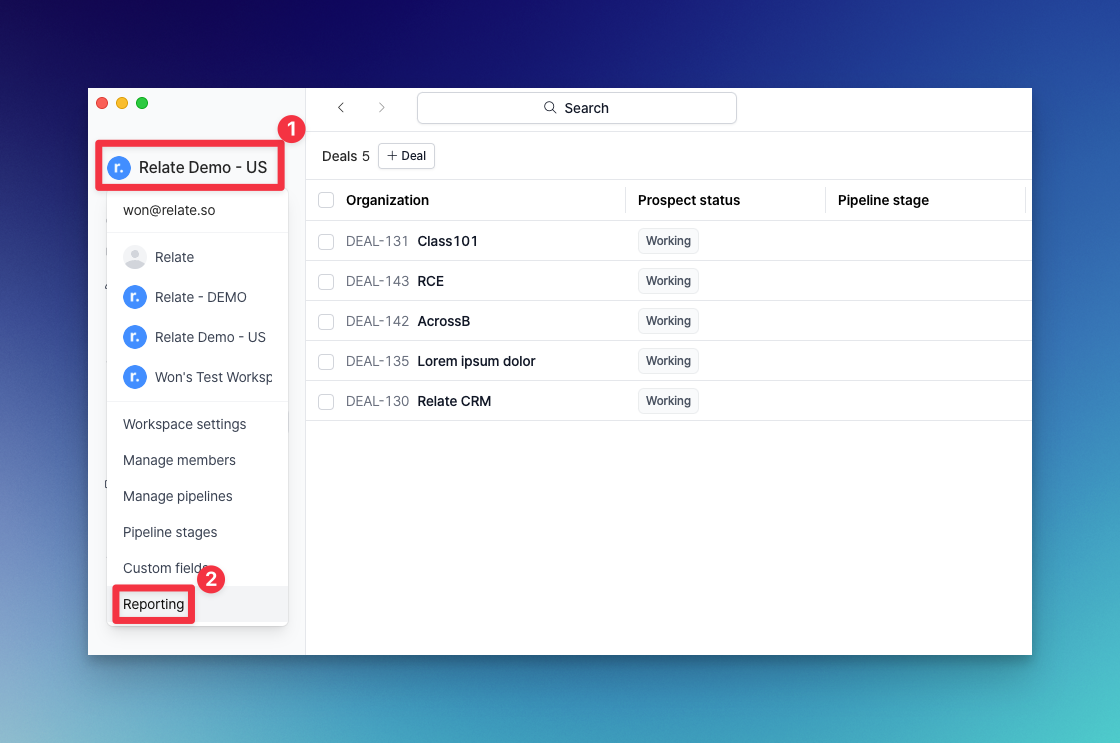
Relate has simple and powerful reporting for sales. You can use this to find actionable insights for your sales team.Accessing the Reporting page
Reporting at the bottom of the list.
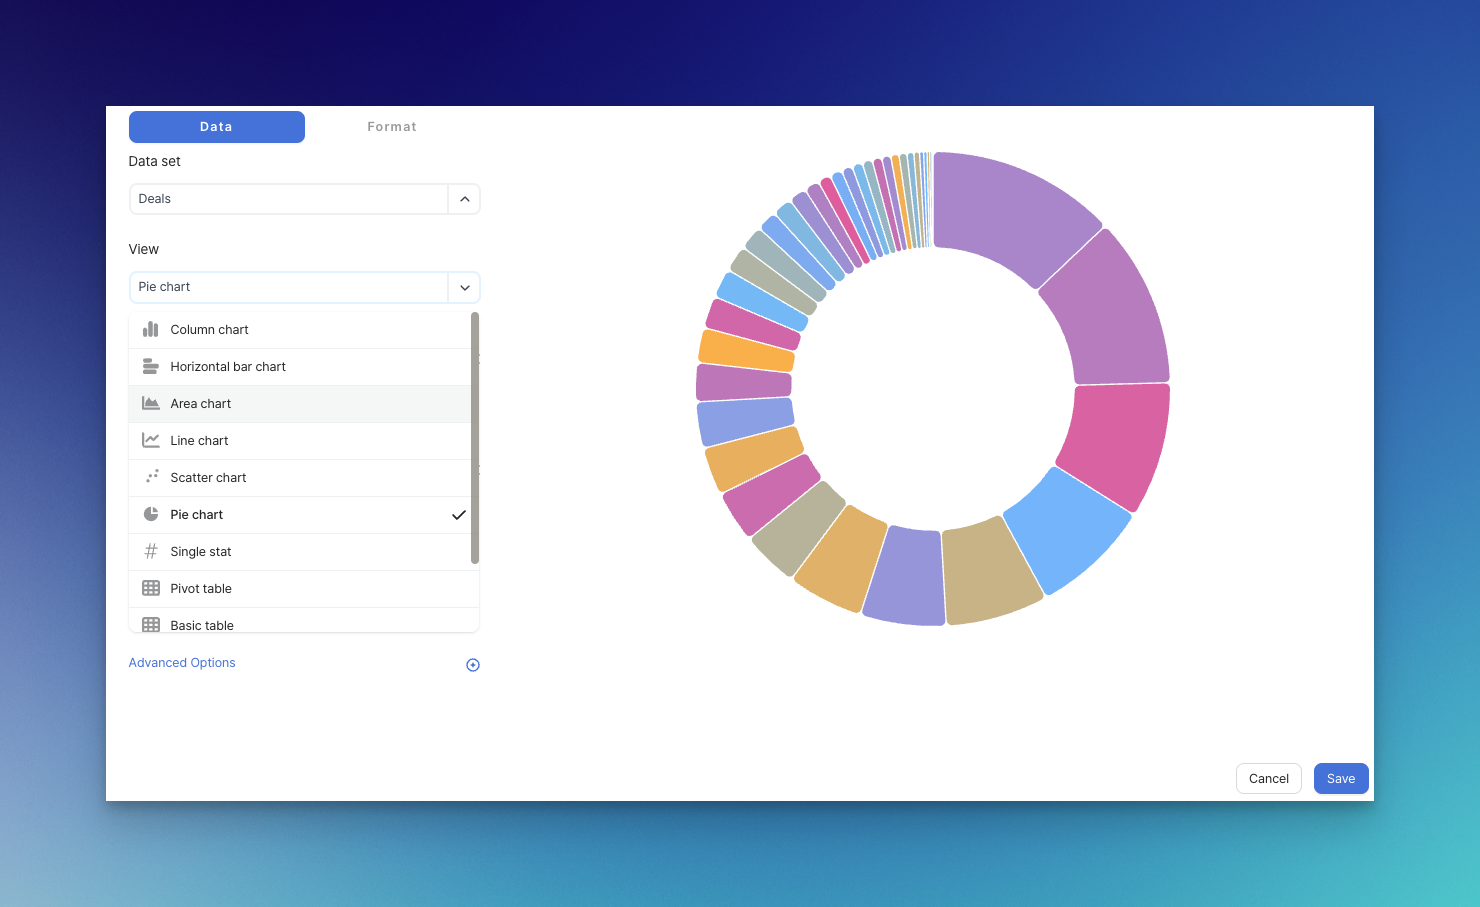
Adding a custom chart to your dashboard
If you want to add a new chart other than the five default charts, click theSelect Template or + Add View button at the bottom. Select Template uses pre-built templates and + Add View creates one from scratch.

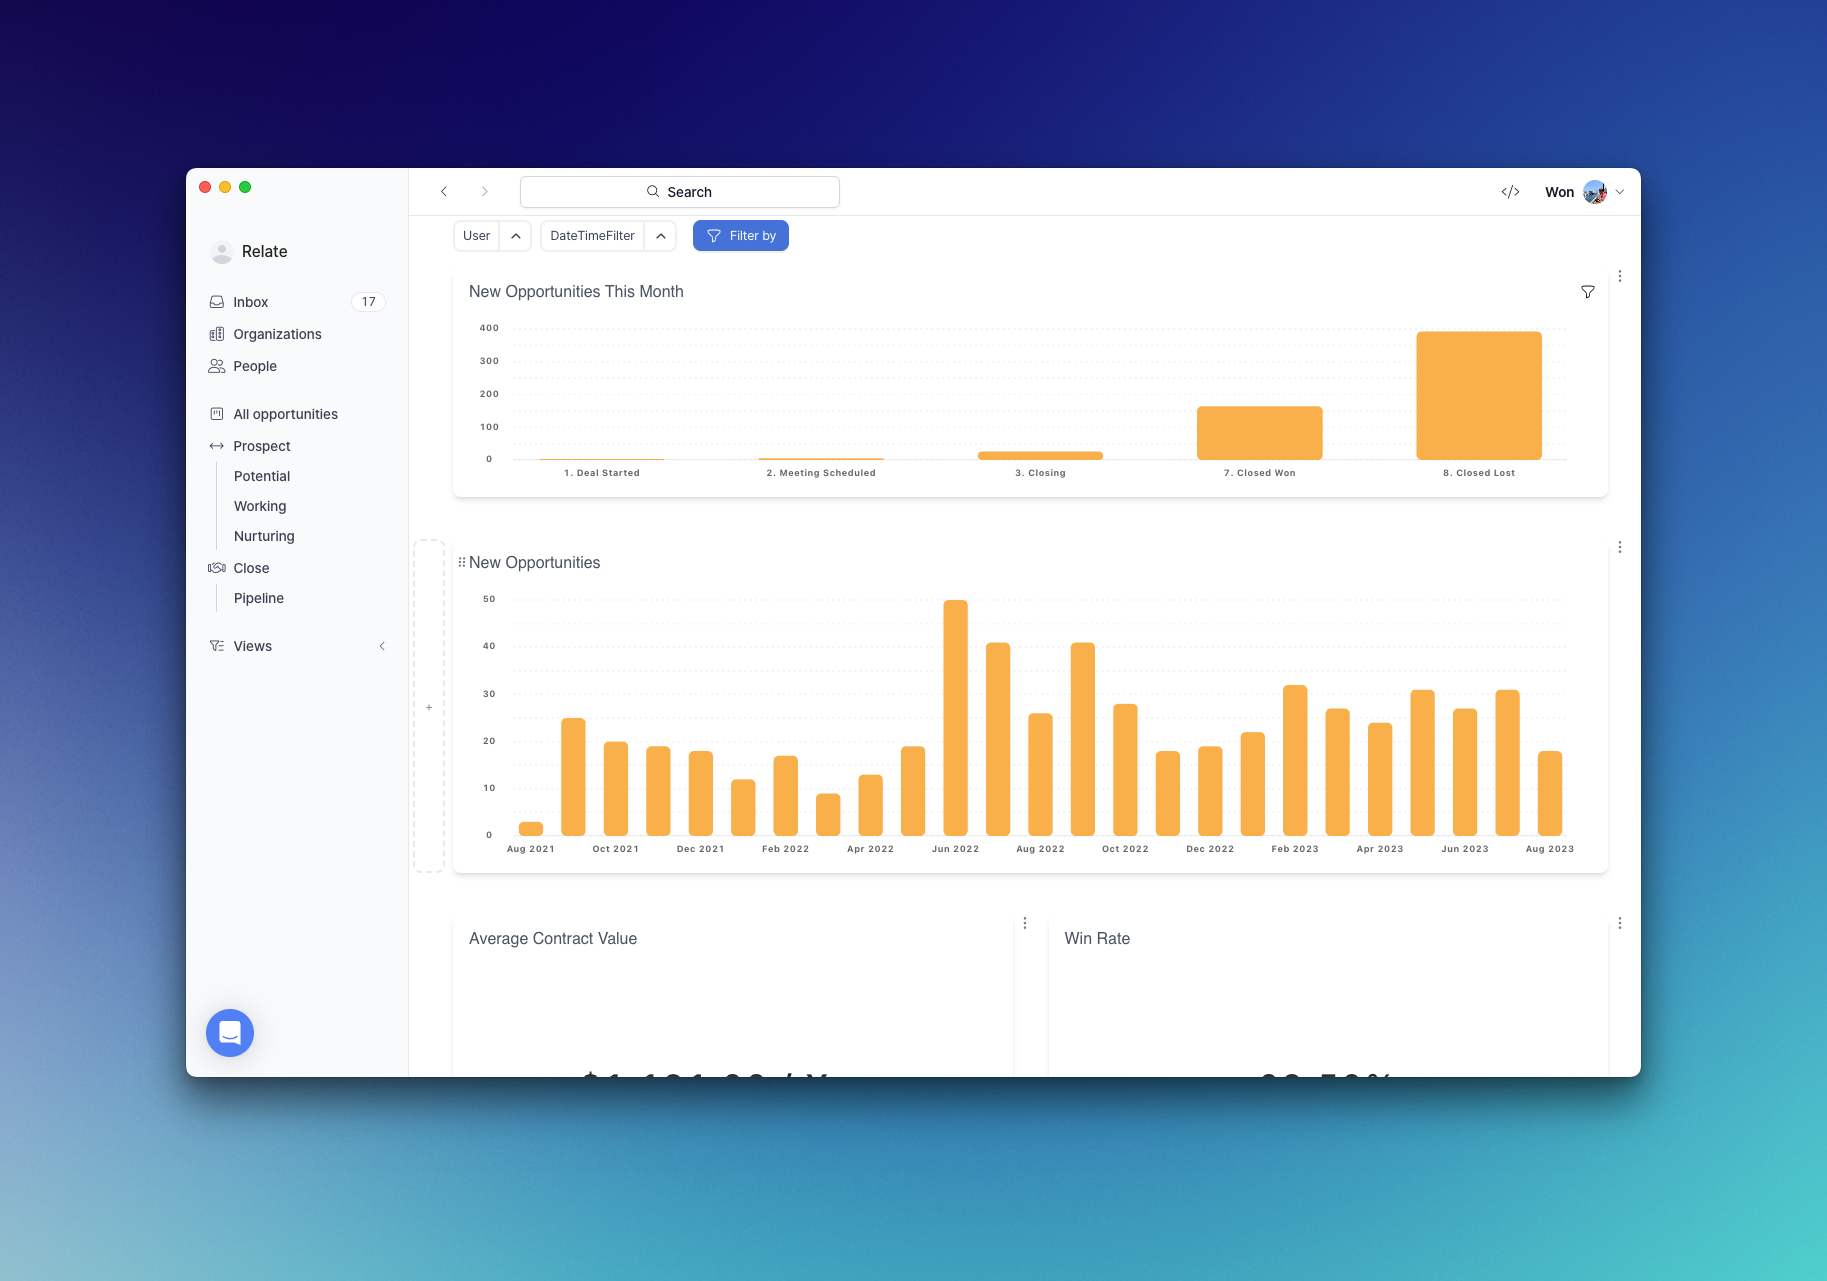
Five default charts
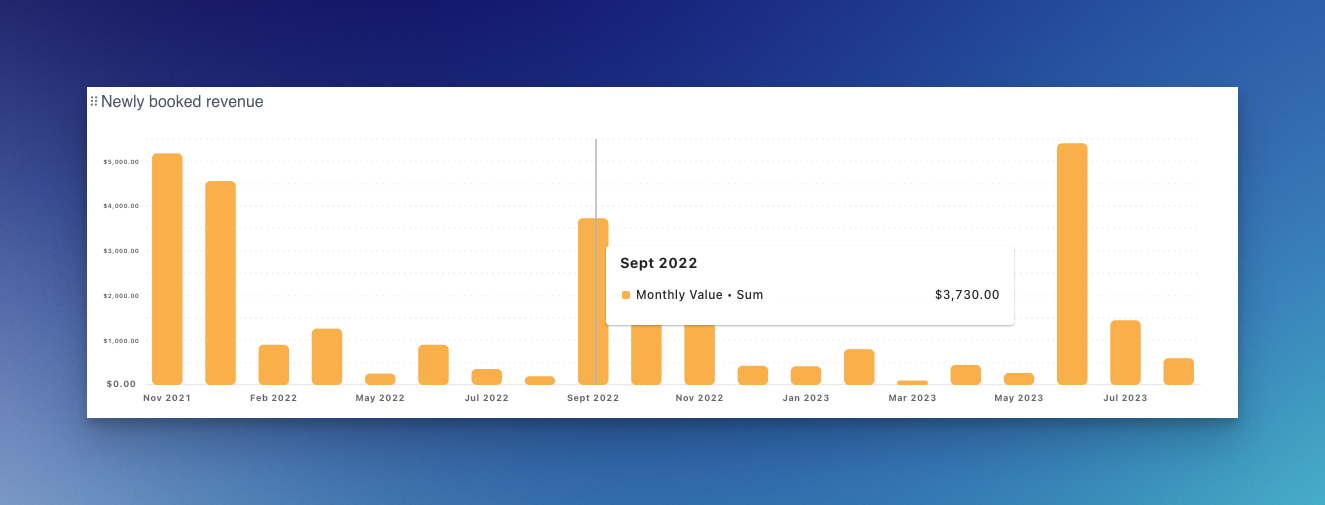
Currently, our reporting provides five charts by default:- Newly booked revenue
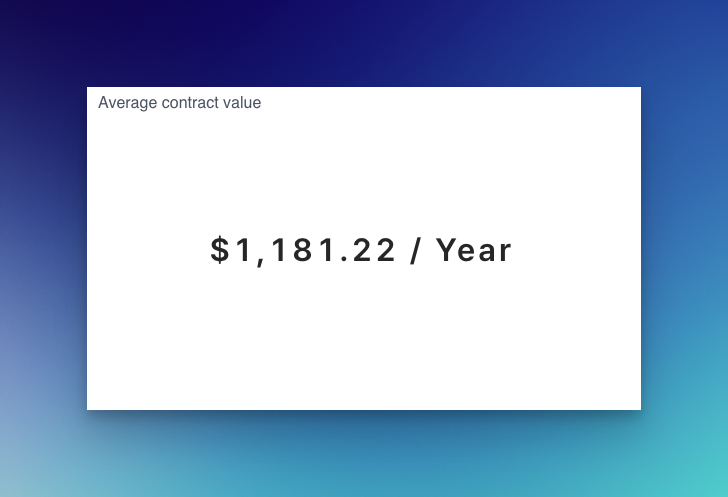
- Annual contract value(ACV)
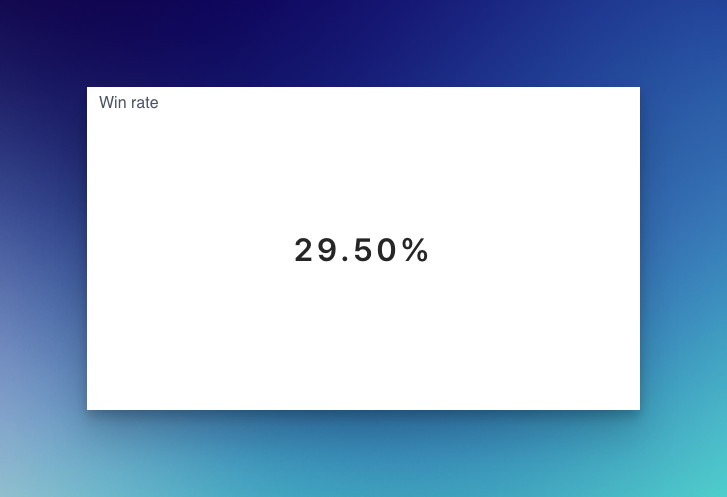
- Win rate
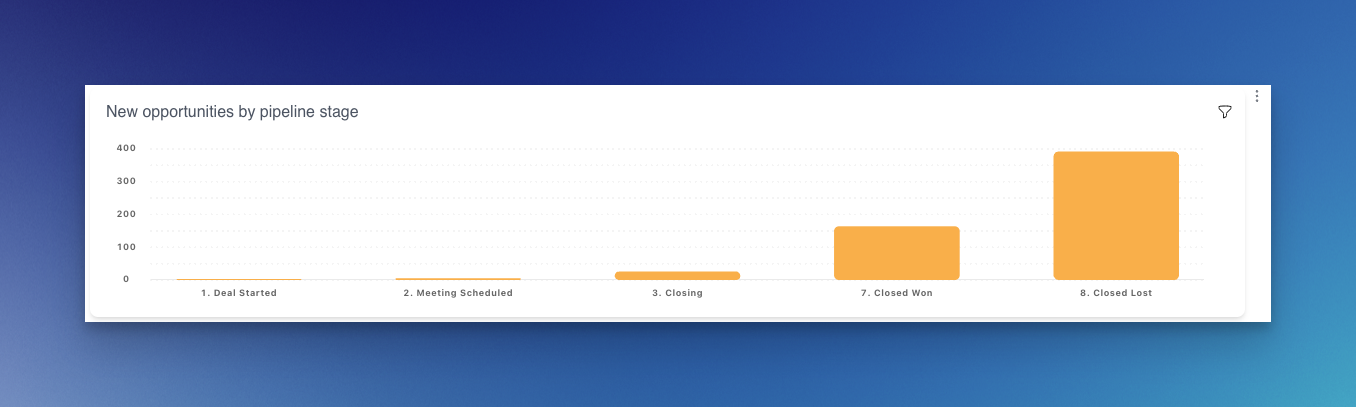
- New opportunities by pipeline stage
- New opportunities over time
Newly booked revenue
Annual Contract Value (ACV)
Win rate
New opportunities by pipeline stage
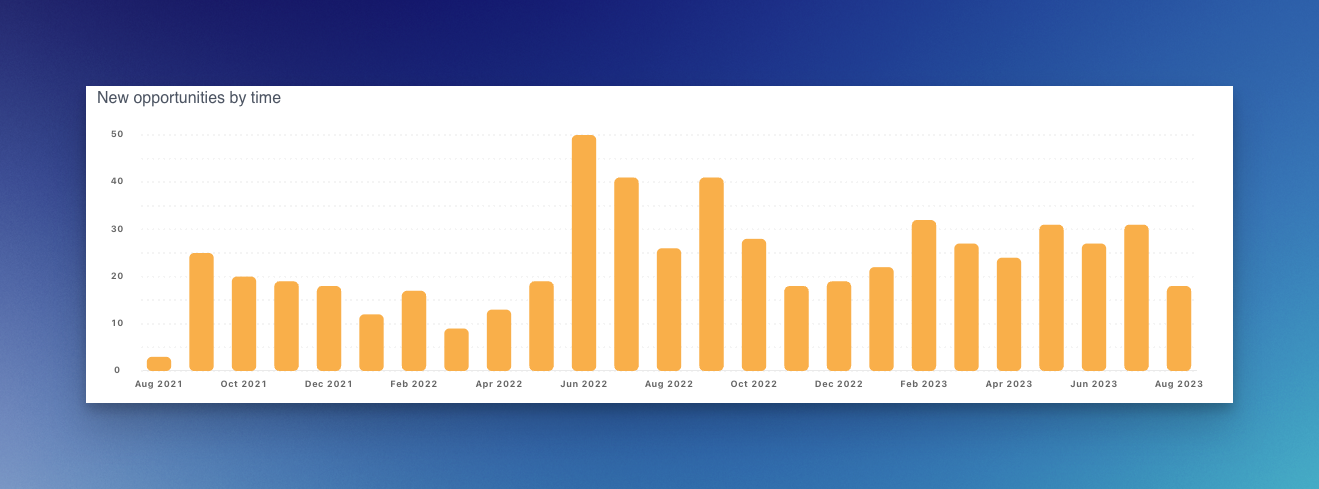
New opportunities by time