> ## Documentation Index
> Fetch the complete documentation index at: https://relate.so/docs/llms.txt
> Use this file to discover all available pages before exploring further.
# Reporting
> Simple and powerful reporting for sales
 ## Overview
Relate has simple and powerful reporting for sales. You can use this to find actionable insights for your sales team.
## Overview
Relate has simple and powerful reporting for sales. You can use this to find actionable insights for your sales team.
Need more flexible, custom reporting? Connect **Relate MCP** and ask an AI agent for the report you want in natural language — going beyond the built-in charts to analyze pipeline conversion rates, deals stalled for 2+ weeks, per-assignee breakdowns, and more. See the [Relate MCP](/docs/ai/relate-mcp) guide.
## Accessing the Reporting page
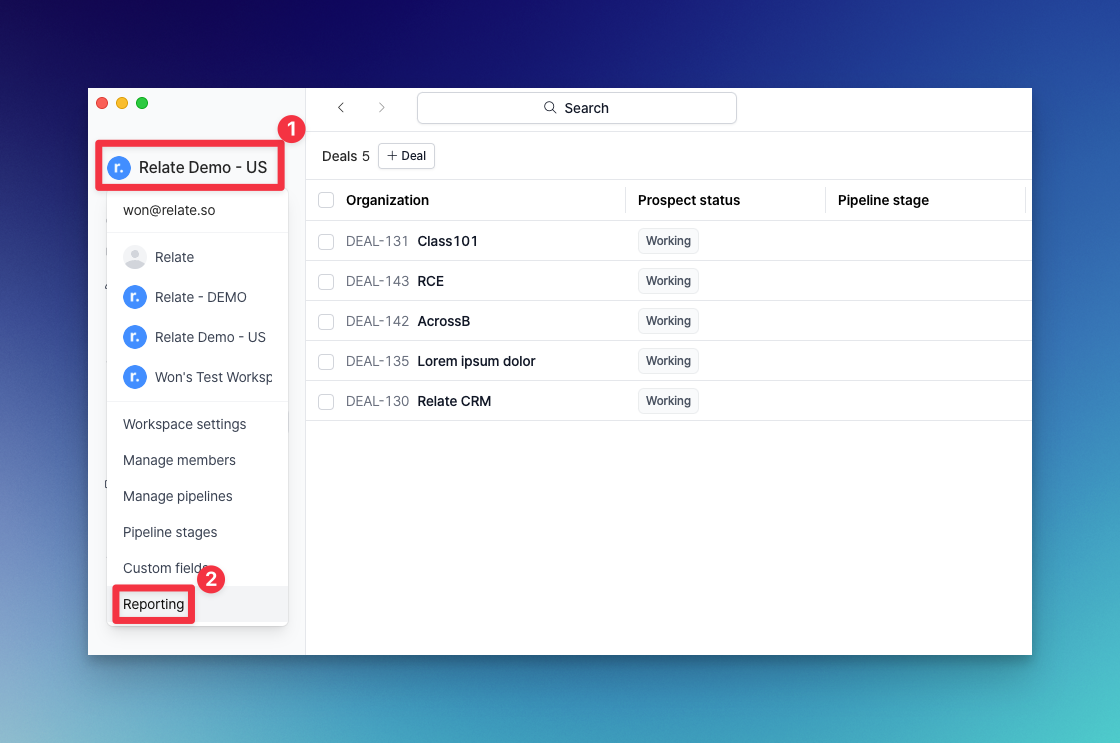
 Click the workspace logo in the top left corner in your workspace. Then click `Reporting` at the bottom of the list.
 ## Adding a custom chart to your dashboard
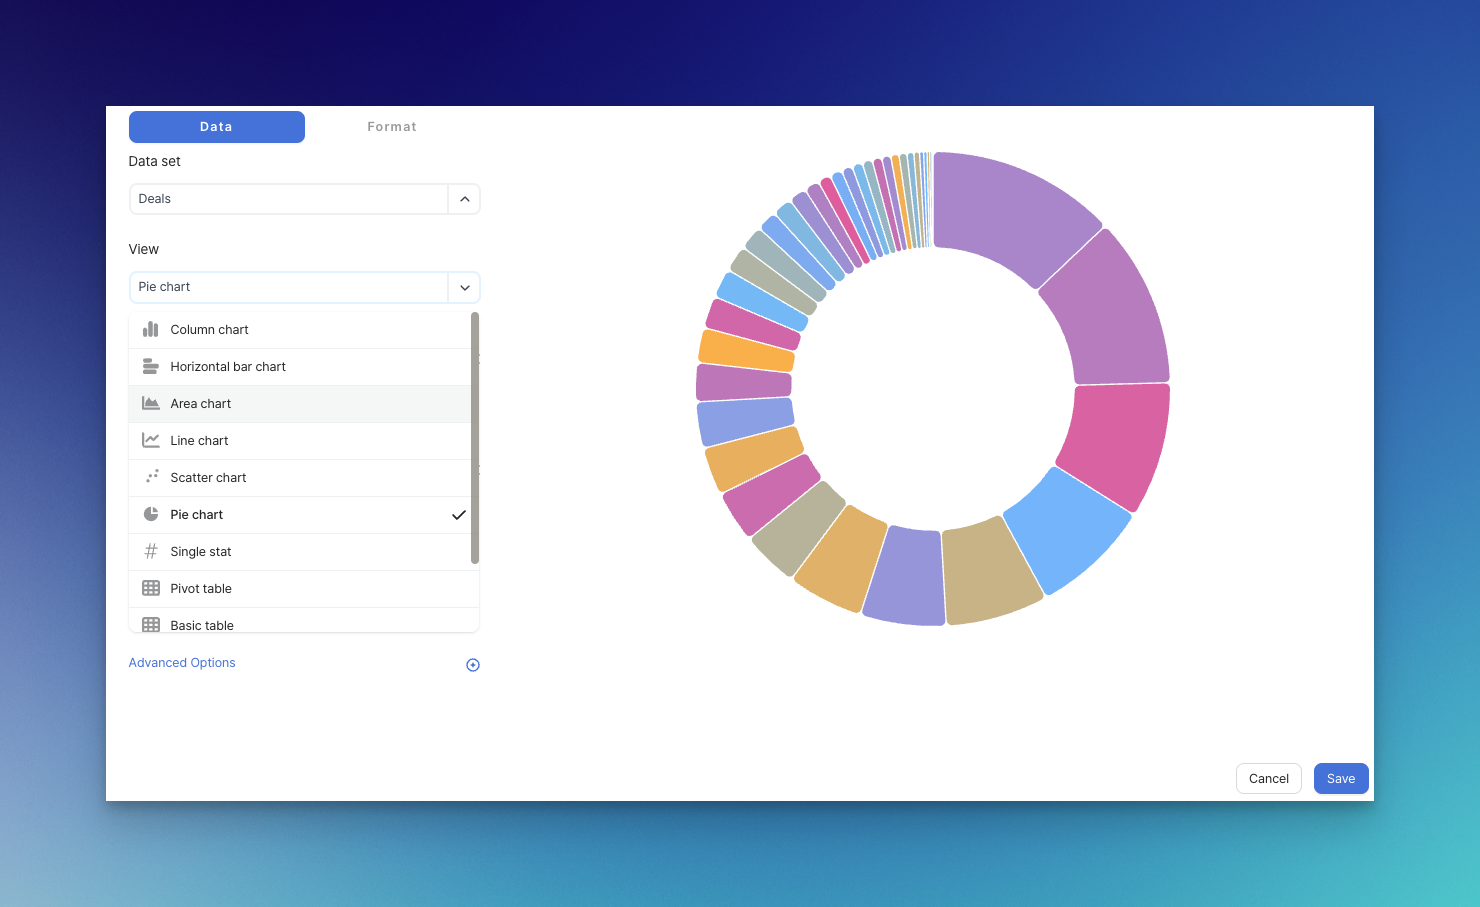
If you want to add a new chart other than the five default charts, click the `Select Template` or `+ Add View` button at the bottom. `Select Template` uses pre-built templates and `+ Add View` creates one from scratch.
## Adding a custom chart to your dashboard
If you want to add a new chart other than the five default charts, click the `Select Template` or `+ Add View` button at the bottom. `Select Template` uses pre-built templates and `+ Add View` creates one from scratch.
 When creating a new chart, you can use any data set available in the list.
 ## Five default charts
Currently, our reporting provides five charts by default:
* [Newly booked revenue](/docs/features/reporting#newly-booked-revenue)
* [Annual contract value(ACV)](/docs/features/reporting#annual-contract-value-acv)
* [Win rate](/docs/features/reporting#win-rate)
* [New opportunities by pipeline stage](/docs/features/reporting#new-opportunities-by-pipeline-stage)
* [New opportunities over time](/docs/features/reporting#new-opportunities-over-time)
### Newly booked revenue
## Five default charts
Currently, our reporting provides five charts by default:
* [Newly booked revenue](/docs/features/reporting#newly-booked-revenue)
* [Annual contract value(ACV)](/docs/features/reporting#annual-contract-value-acv)
* [Win rate](/docs/features/reporting#win-rate)
* [New opportunities by pipeline stage](/docs/features/reporting#new-opportunities-by-pipeline-stage)
* [New opportunities over time](/docs/features/reporting#new-opportunities-over-time)
### Newly booked revenue
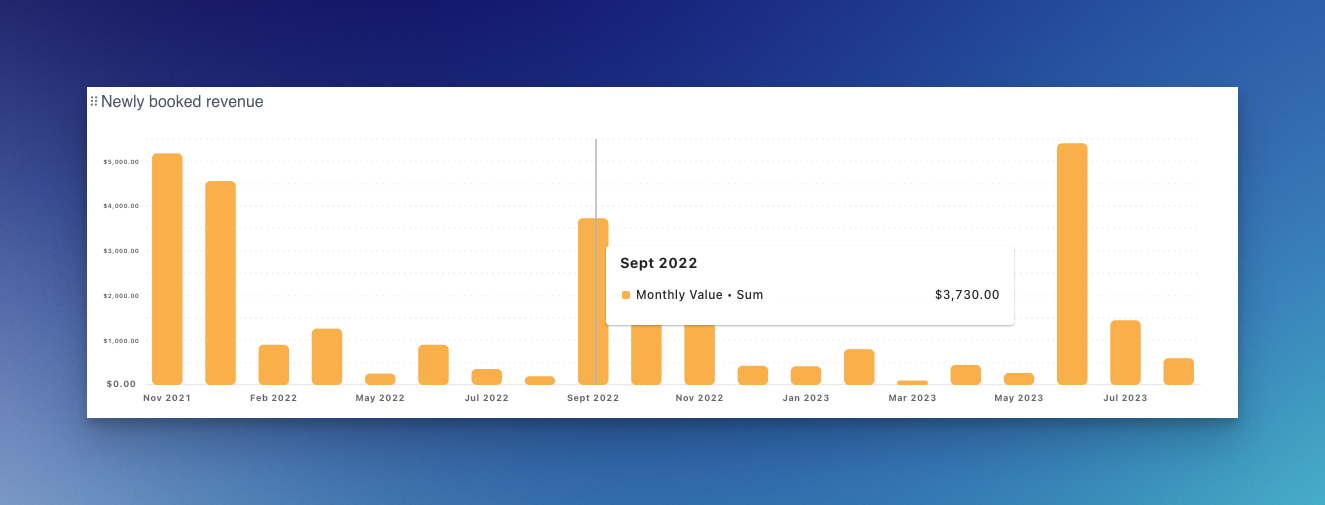 Newly booked revenue shows you how much your sales team generated by month.
If you want to see it by year, or if you want to edit and add data, you can do so by pressing the Ellipsis (⋅⋅⋅) button on the far right.
### Annual Contract Value (ACV)
Newly booked revenue shows you how much your sales team generated by month.
If you want to see it by year, or if you want to edit and add data, you can do so by pressing the Ellipsis (⋅⋅⋅) button on the far right.
### Annual Contract Value (ACV)
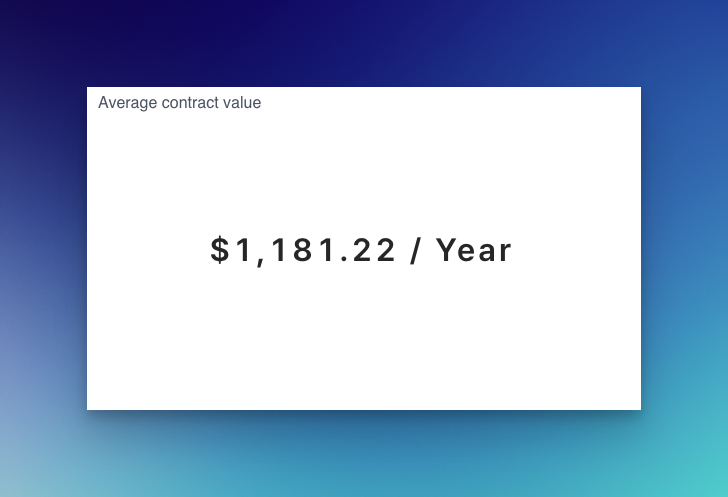 [Annual contract value](https://www.relate.so/docs/wiki/acv) refers to the annualized revenue per customer contract. ACV is an important financial metric for SaaS companies and companies that predominantly deal with yearly subscriptions and contracts.
### Win rate
[Annual contract value](https://www.relate.so/docs/wiki/acv) refers to the annualized revenue per customer contract. ACV is an important financial metric for SaaS companies and companies that predominantly deal with yearly subscriptions and contracts.
### Win rate
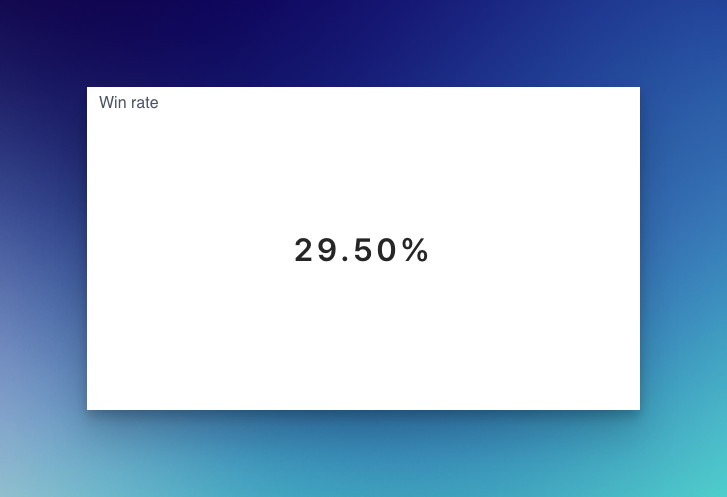 Win rate refers to the percentage of qualified sales opportunities the sales team successfully closes and is one of the important sales metrics.
[Qualified sales opportunities or sales qualified leads](https://www.relate.so/docs/wiki/sql) are prospects that have gone through the prospecting process to confirm a fit with your product and have immediate sales opportunities.
We recommend using it with Relate's [Prospect](https://www.relate.so/docs/features/how-to-manage-prospect-status#prospect-status) feature for more accurate data. You should only add qualified sales opportunities to your pipeline.
Knowing your win rate also tells you how many deals you should add to your pipeline. For example, if your win rate is 50%, you know that you need to have a total of 8 deals in your pipeline to close 4 deals.
### New opportunities by pipeline stage
Win rate refers to the percentage of qualified sales opportunities the sales team successfully closes and is one of the important sales metrics.
[Qualified sales opportunities or sales qualified leads](https://www.relate.so/docs/wiki/sql) are prospects that have gone through the prospecting process to confirm a fit with your product and have immediate sales opportunities.
We recommend using it with Relate's [Prospect](https://www.relate.so/docs/features/how-to-manage-prospect-status#prospect-status) feature for more accurate data. You should only add qualified sales opportunities to your pipeline.
Knowing your win rate also tells you how many deals you should add to your pipeline. For example, if your win rate is 50%, you know that you need to have a total of 8 deals in your pipeline to close 4 deals.
### New opportunities by pipeline stage
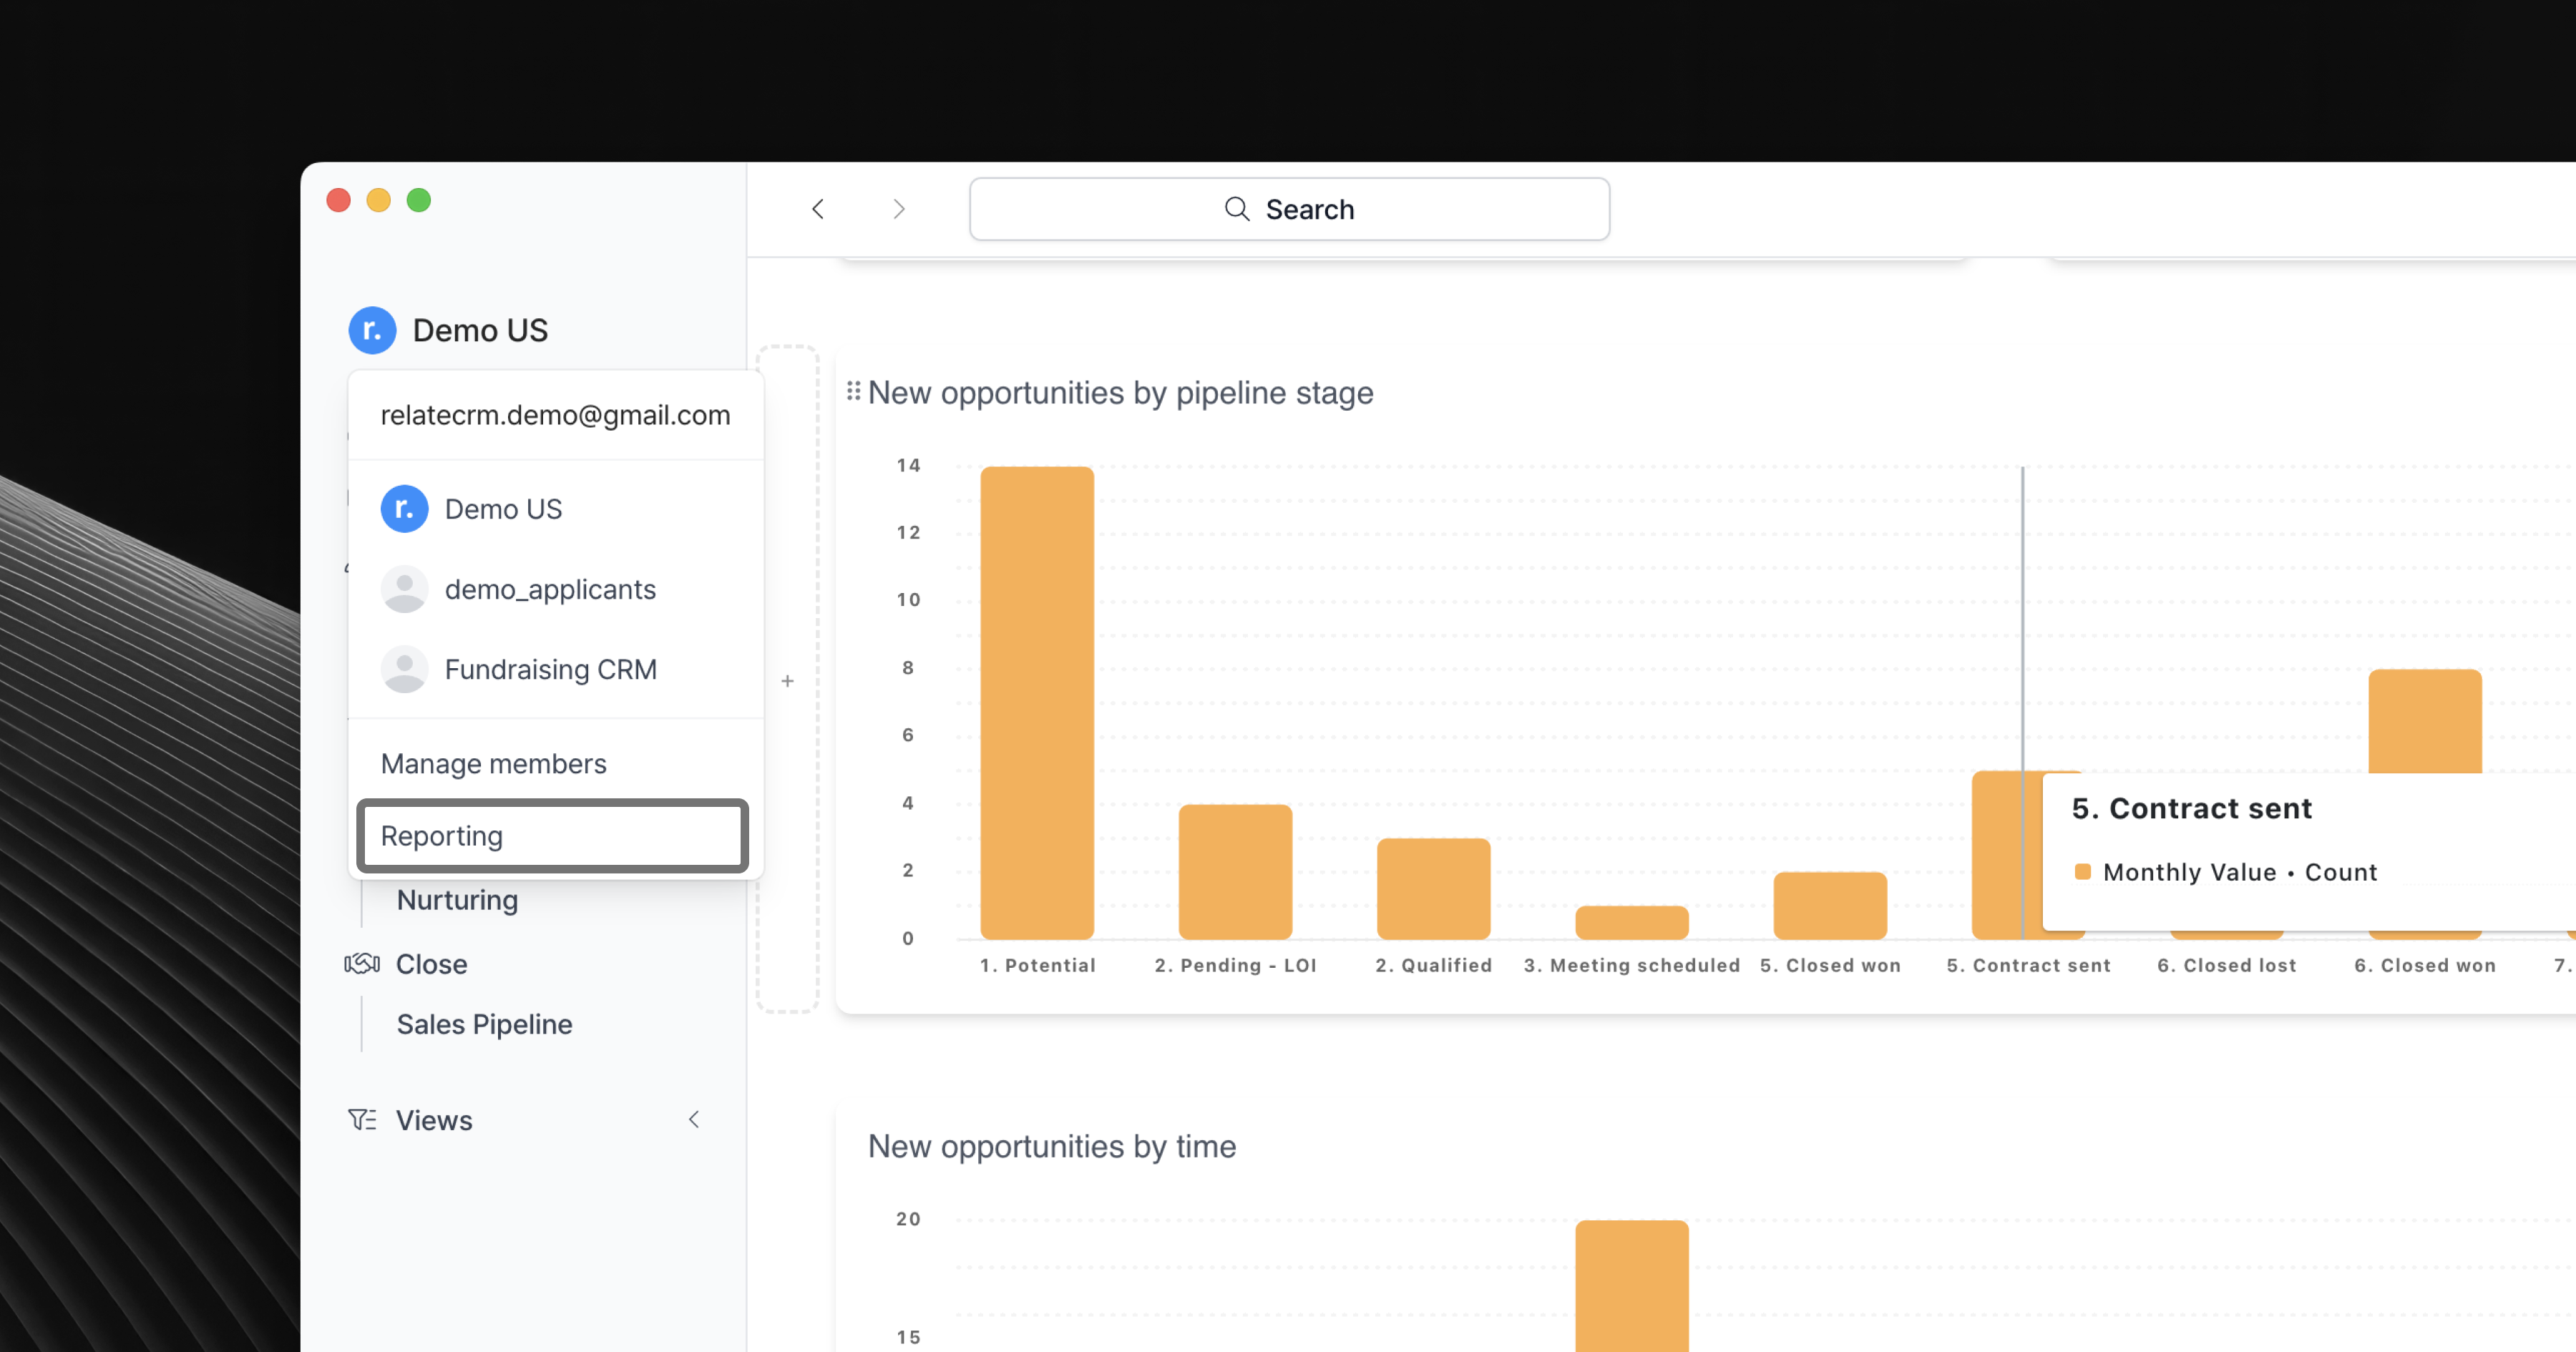
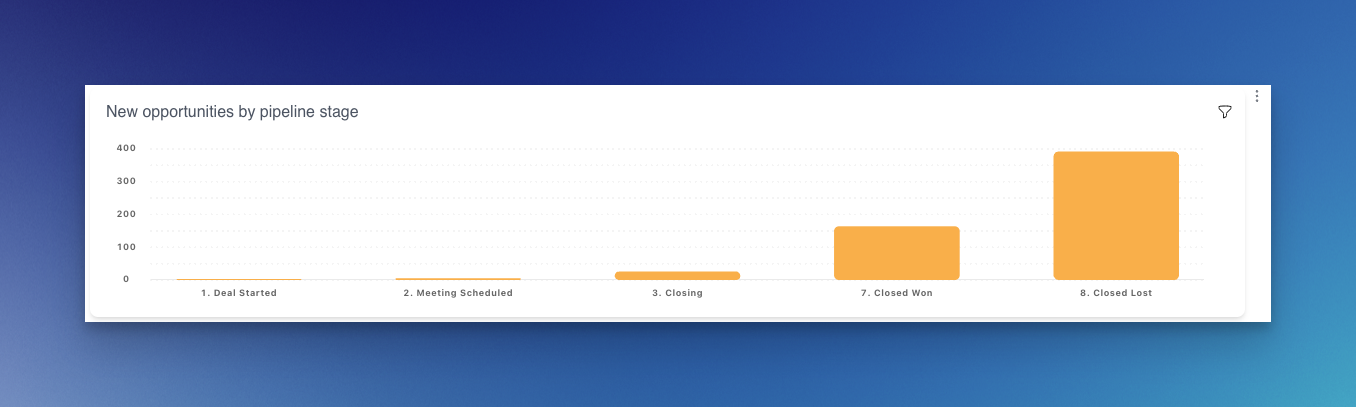 In New opportunities by pipeline stage, you can see how many new qualified sales opportunities have been created and how many are in each pipeline stage.
It shows all neswly created sales opportunities from the time you started using Relate, so if you want to see sales opportunities created in a specific time frame, you can apply a filter. Filters can be added by pressing the Ellipsis (⋅⋅⋅) button on the far right.
### New opportunities by time
In New opportunities by pipeline stage, you can see how many new qualified sales opportunities have been created and how many are in each pipeline stage.
It shows all neswly created sales opportunities from the time you started using Relate, so if you want to see sales opportunities created in a specific time frame, you can apply a filter. Filters can be added by pressing the Ellipsis (⋅⋅⋅) button on the far right.
### New opportunities by time
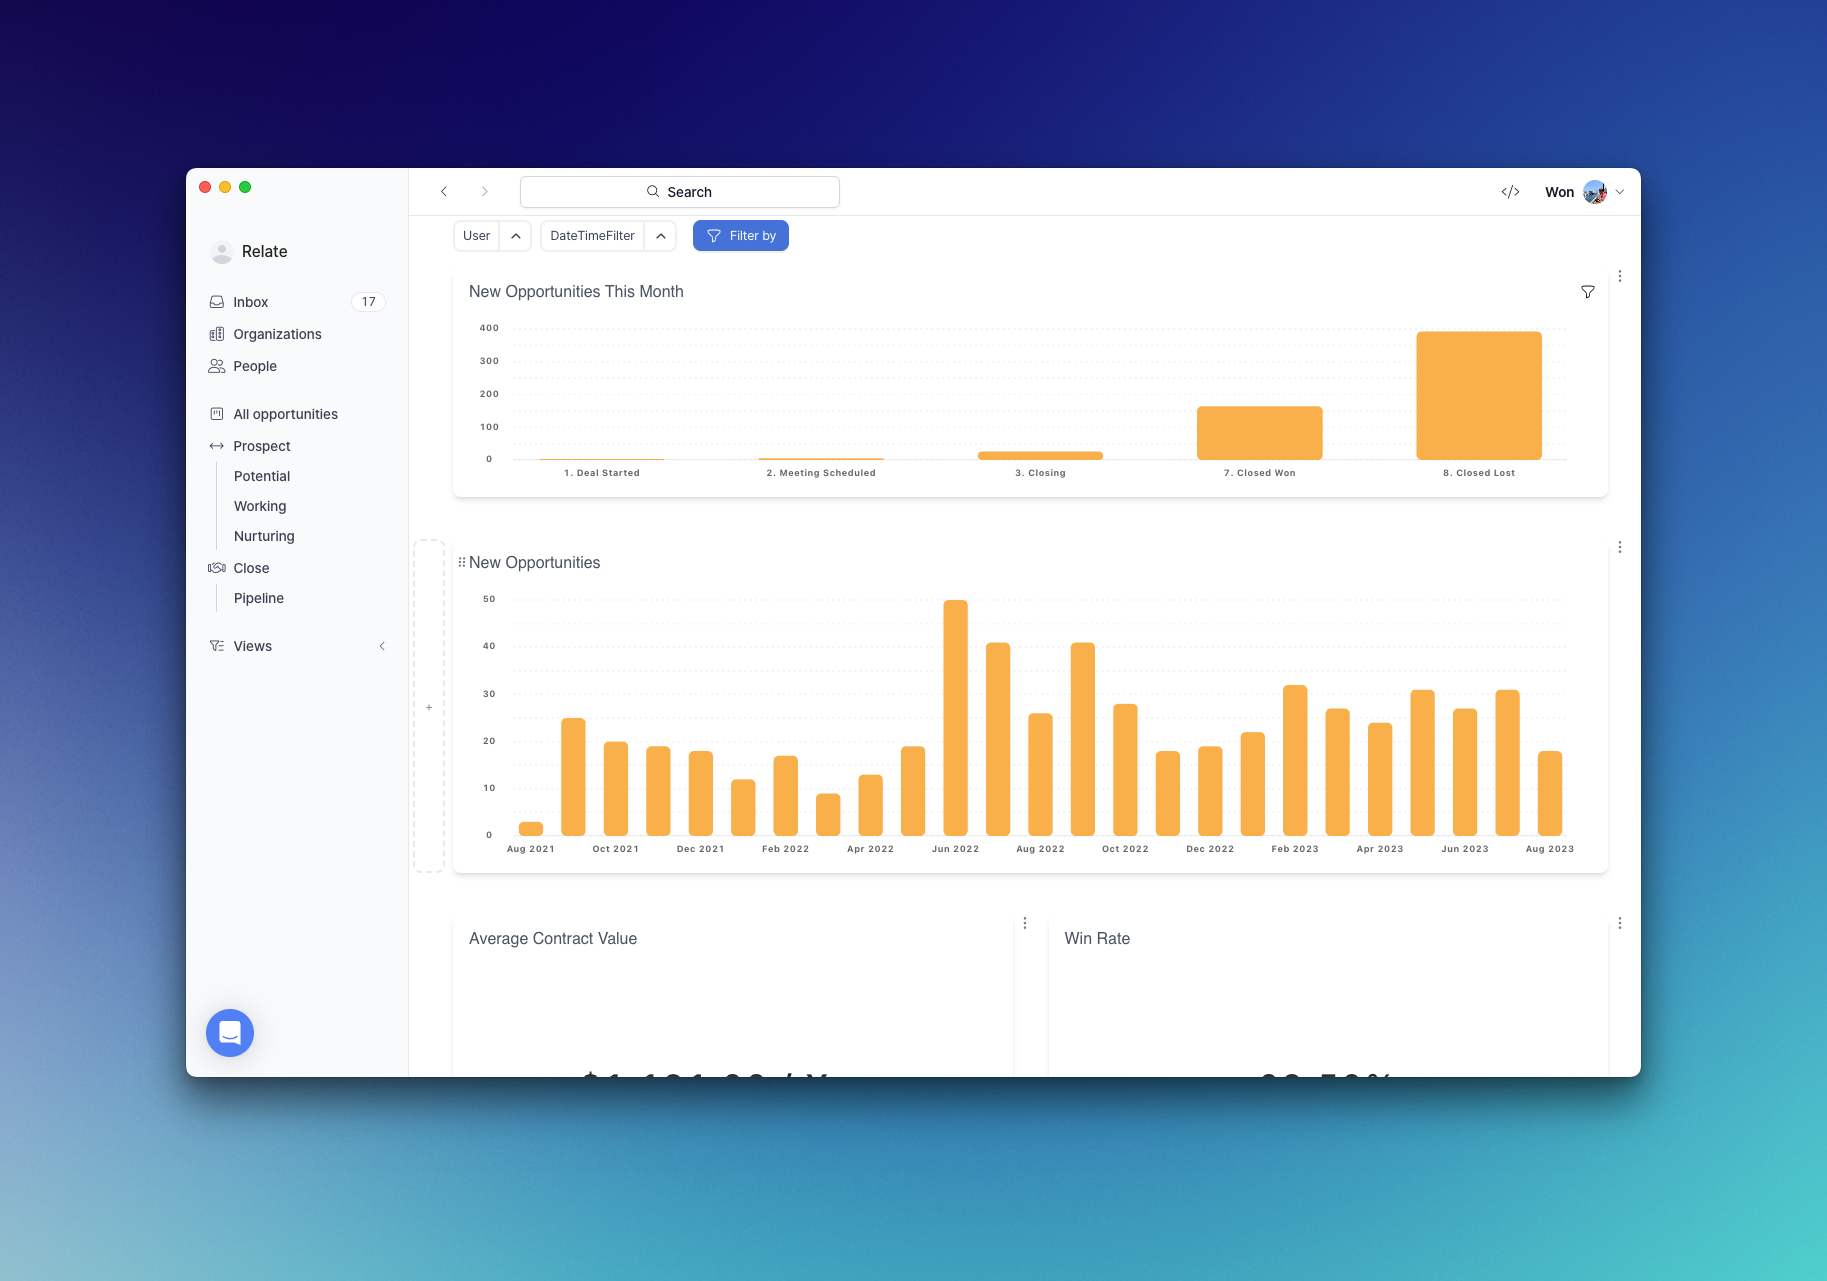
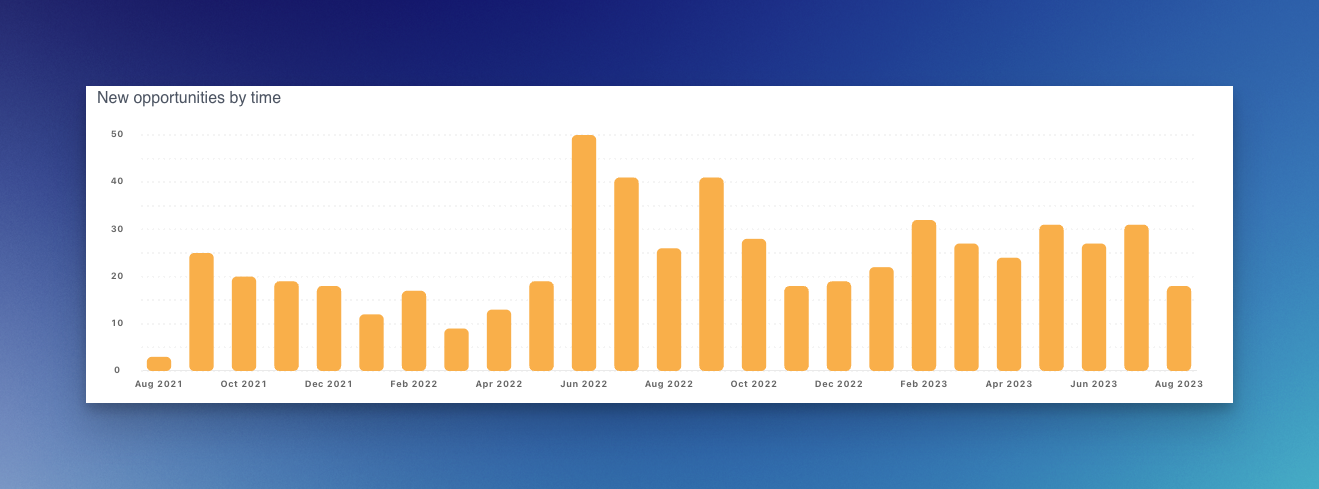 In New opportunities by time, you can see how many qualified sales opportunities are added each month.
Ensuring that your sales team is consistently adding new sales opportunities to the pipeline is the most important part of generating and growing revenue.
In New opportunities by time, you can see how many qualified sales opportunities are added each month.
Ensuring that your sales team is consistently adding new sales opportunities to the pipeline is the most important part of generating and growing revenue.